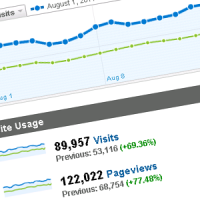
Much like July, the traffic stats for August were pretty steady throughout the month. There were a few dips that were followed by increases, but overall the traffic level remained consistent.
The one thing, however, that I have noticed is that my traffic seemed to have a minor slowdown compared to both July and August 2010. While there is still a nice increase year-over-year, the overall increase was lower than the previous three month increases. Below is my traffic analysis for August 2011.
The Steady Traffic Trend
When looking at my traffic stats for August I notice that the traffic from day to day is fairly steady. Some days may seen fewer visitors, while others may see more visitors. This is quite normal as each day won’t produce the same number of visitors.
The overall average traffic, however, appears to have remained stead throughout the month. There were no noticeable social networking traffic spikes, no were there any mysterious drops in traffic. The chart below shows the traffic levels throughout the month.

Click to enlarge
While the traffic remained steady, year-over-year there was a healthy increase in both visits and pageviews. The increase, however, was the lowest since I started to record my traffic stats. The past three months has usually seen an increase over 70% for visits and over 80% for pageviews, but this month both values were lower.
The table below shows the traffic difference year-over-year for the month of August.
| Metric | August 2010 | August 2011 | Change |
|---|---|---|---|
| Visits | 53,116 | 89,957 | 69.36% |
| Pageviews | 68,754 | 122,022 | 77.48% |
In terms of comparing the previous month, there was a slight increase around 1,300 visits and an increase of 12 pageviews. While the visit number was a nice increase, the pageviews was very minor. I’m hoping that as long as I continue to publish posts 5 times a week, that I will see the increase month-over-month.
Traffic Sources
As usual, my search engine traffic leads the way in terms of traffic sources. Traffic from search engines accounts for just over 86% of my total visits. The chart below shows the breakdown of my traffic sources.

Click to enlarge
Compared to my previous month, both the direct traffic and referring traffic was down compared to the previous month. Combined the decrease amounted to about 2,000 visits for the month.
The decrease in both direct and referring traffic was offset by the increase in search engine traffic, so overall the total number of visits increased this month over the previous month.
I am hoping to have a better increase in traffic for next month which will hopefully help me to approach 100,000 by the end of this year or the beginning of next year.
