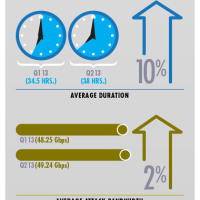
Getting yourself informed on DDoS attack trends from quarter to quarter through the year is a vital part in understanding and preventing these attacks on your data and security. Only through obtaining accurate facts and figures will you able to get yourself properly learned and well-prepared in the event you need protection. Take a look at this infographic to get a clear and coherent review, through stats and figures, of DDoS attacks from the first quarter of 2013, compared to the second quarter.
In merely a single quarter, DDoS attacks have grown not only in size, but power and duration as well. This infographic will give a break down on the comparison of total DDoS attacks, DDoS attack modes, and average duration, bandwidth, and packets-per-second. From the first quarter to the second, the percentage of total DDoS attacks has went up a full 20 percent, while average duration has increased 10 percent. Get detailed info on all aspects of DDoS attacks from the first to second quarter, through this infographic.

The infographic was created by the design and marketing team of Prolexic, a company focusing on preventing and stopping DDoS attacks.
