A few months ago I wrote a post where I talked about how you measure your blog’s success. In that post I mentioned how it is important to set goals for you blog, and then try to achieve those goals. For me, when I achieve a blogging goal I deem my blog to be successful. With each goal I achieve, I enjoy new success with my blog.
Last month I achieve a goal that I had set early in the year. Throughout the year I worked to achieve my goal and it was very gratifying to finally realize the success of achieve that goal. In October, Technically Easy received 100,000 visitors.
Traffic Goal Achieved
I’m not sure what happened in October, but starting from the beginning of the month I say a nice increase in traffic. The increase was large enough where I noticed it immediately while checking the traffic stats.
In the past few months, daily traffic rose a few times above 3,000 visitors a day, but would drop between 2,500 to 3,000 for the following few days. In October, however; traffic rose about 3,000 and stayed above that level for the entire month. Traffic would even stay about 3,500 for several days.
I haven’t done any research yet into what happened, or what posts began to generate the traffic. I’m not sure if the Panda updates by Google provided more traffic to my blog, but I’ll have to dive into the numbers to see what really happened.
The traffic levels for each day of October 2011 can be seen in the chart below.

(Click to enlarge)
The interesting thing about the above chart is that there appears to be a wave-like pattern to the traffic numbers. One day it would increase, and then slowly decrease and then increase again. It is a pattern that I hadn’t seen in any month previous to this month.
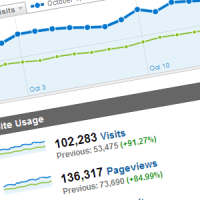
The increase in traffic can also be seen in the year-over-year numbers as shown in the table below.
| Metric | October 2010 | October 2011 | Change |
|---|---|---|---|
| Visits | 53,475 | 102,283 | 91.27% |
| Pageviews | 73,690 | 136,317 | 84.99% |
Both visits and page views had very healthy increases compared to October 2010. The amount of visits increased over 90% while the pageviews increased almost 85%. This was the most year-over-year increases I have seen in a few months, as my traffic growth had slowed the previous two months.
Traffic Sources for October 2011
While I began to watch my traffic increase each day, I was thinking that I was attracting more referring traffic numbers. It turns out that search engines – mainly Google – was sending more traffic to my blog.
The chart below shows the traffic sources distribution for Technically Easy in October 2011.

(Click to enlarge)
For the first time, search engine traffic accounted for 90,000 visits. This was a nice increase from previous months, and it was more than the total visit count for each of the previous months.
Direct Traffic is second as a traffic source followed by referring traffic. Both also saw nice increases which added to my traffic numbers for the month, although they are still far behind the search engines as a source of traffic.
With my goal of reaching 100,000 visitors accomplished, I now look at achieving a new goal of 200,000 visitors for a month. I’ll try to see if I can accomplish this goal by the end of next year, which will require me to continue to put in the work.
