At the end of June, I saw a quick drop in traffic on the second to last day of the month. The last day of June ended with normal traffic day, but I was wondering how July would fair. That drop in traffic is still a question mark, but I was happy to see that it didn’t repeat itself at any point in July.
For the month, July was a good month in traffic. There was the usual small increases on a few days, but for the most part there wasn’t anything really interesting. The amount of traffic received each day was fairly consistent throughout the month, which is nice, but a few days had some good amount of traffic.
A Fairly Static Month
My goal for this month was to keep increasing the traffic to my blog, as it is every month. Each month that I achieve that goal, I am always wondering how much more traffic I can generate before I reach a plateau, or start to see a small decrease.
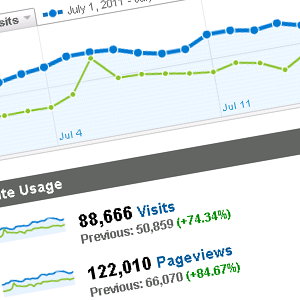
I have experienced traffic plateaus in the past, and they usually require me to step back and evaluate the traffic to my blog. This month, however, I managed to increase both the number of visitors and pageviews my blog received. Below is the graph of visits to Technically Easy for July 2011.

(Click to enlarge)
As you can see, the traffic levels for the month were fairly consistent. Around July 24th and July 25th, there was a minor surge in traffic before it leveled down again to more normal traffic levels.
The traffic for the month increased nicely from the previous year, as the table below illustrates.
| Metric | July 2010 | July 2011 | Change |
|---|---|---|---|
| Visits | 50,859 | 88,666 | 74.34% |
| Pageviews | 66,070 | 120,010 | 84.67% |
Both the number of visits and pageviews increased over 70% over July the previous year. While month to month may not see a huge increase, the year over year values indicate otherwise. The past few months have shown this trend, which I am hoping to repeat each month.

(Click to enlarge)